

MyType.lol / Data & context
MyType.lol statistics: what do face choices reveal?
Curious about your MyType? Explore what a published face preference study reveals about the choices people make, then discover your own type with MyType.lol.
Find your type on MyType.lol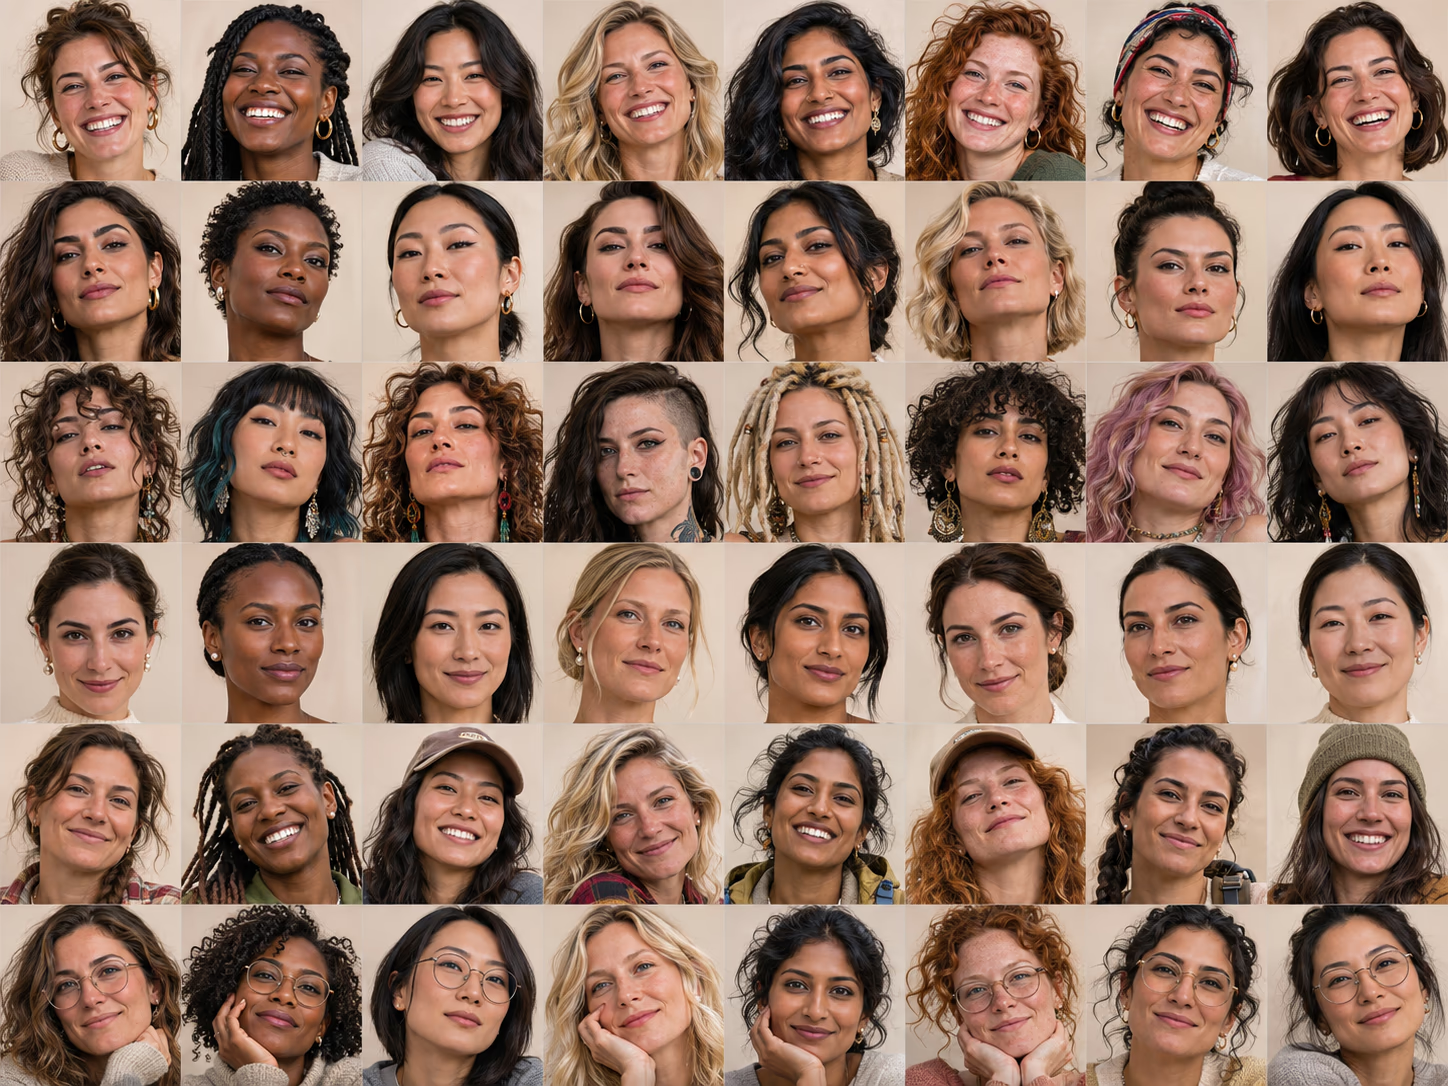
01 / The sample
One week, millions of choices.
The reference study recorded activity in a self-selected online test. A run is a browser’s pass through the test on one UTC day, not necessarily a unique person. Its participants, face deck and recommendation system differ from MyType.lol.
4,502,629
taps in the reference study
48,356
test runs in the reference study
155
countries with a run in the reference study
43,673 runs reached a result; 1,084,545 grids were completed. Across all grids, 37.7% were passed without a tap. Those totals include personalized grids and replacement faces.
The week in numbers
| Activity | Total |
|---|---|
| Runs started | 48,356 |
| Runs reaching a result (6+ grids) | 43,673 (90.3%) |
| Grids completed | 1,084,545 |
| Faces shown, including recommendations | 17,518,035 |
| Taps across all grids | 4,502,629 |
| Grids passed with no tap | 408,784 (37.7%) |
| Runs on men’s faces | 25,540 (52.8%) |
| Runs on women’s faces | 16,993 (35.1%) |
| Runs on both decks | 5,823 (12.0%) |
| Countries represented | 155 |
The busiest day was November 13, with 16,016 runs. A result required at least six grids in this source test.
02 / Randomly shown faces
How selective were the choices?
The rates below use randomly dealt faces, excluding personalized recommendations. A randomly shown face was tapped 10.3% of the time for women’s faces and 10.1% for men’s faces. On 52.5% and 55.0% of the respective random grids, no face was tapped.
Women’s faces
10.3%
114,023 taps / 1,102,902 random showings
Men’s faces
10.1%
171,546 taps / 1,700,370 random showings
When one run tapped a randomly shown face, another run shown the same face tapped it 16.4% of the time for women’s faces and 15.7% for men’s. The deck labels describe the faces shown, not the identity of the people choosing them.
03 / Selectivity
More than half of random grids got no tap.
A grid of twelve faces sounds like plenty of choice. Yet in most randomly dealt grids, the run selected none of them. This is useful context for any MyType-style test: passing over a crowd can be part of a clear preference pattern. It does not mean that a participant has failed to make a choice.
No faces
1 face
2 faces
3 faces
4 faces
5 faces
6–12 faces
Source: The Face Report, November 10–16, 2026. Rates refer to randomly shown AI faces in its test. Women’s deck: 75,968 grids; men’s deck: 127,300 grids. Published percentages are rounded.
View chart data
| Category | Women’s faces | Men’s faces |
|---|---|---|
| No faces | 52.5% | 55% |
| 1 face | 19.3% | 17.2% |
| 2 faces | 10.8% | 9.6% |
| 3 faces | 6.5% | 6.3% |
| 4 faces | 4.1% | 4.3% |
| 5 faces | 2.7% | 2.9% |
| 6–12 faces | 4.1% | 4.6% |
Across the 43,673 runs that reached a result, the median was 3.47 taps per grid. That is much higher than the random-grid rate because later grids were mostly personalized and a tap brought a replacement face into view. One grid could therefore accumulate more than twelve taps. The lower quarter of runs averaged 1.46 taps or fewer; the upper quarter averaged 7.87 or more.
The spread across a whole run
| Deck | Lower tenth ≤ | Lower quarter ≤ | Median | Upper quarter ≥ | Upper tenth ≥ |
|---|---|---|---|---|---|
| All decks | 0.63 | 1.46 | 3.47 | 7.87 | 15.75 |
| Women’s faces | 0.67 | 1.50 | 3.45 | 7.60 | 14.86 |
| Men’s faces | 0.58 | 1.41 | 3.43 | 8.00 | 16.21 |
| Both decks | 0.69 | 1.63 | 3.70 | 8.29 | 16.50 |
Taps per grid; personalized grids and replacement faces are included.
04 / Shared taste
People agree a little. Most picks still differ.
If someone likes a face, does that make another person more likely to like it too? In the reference study, yes. When the first run tapped a randomly shown face, the second run tapped it 16.4% of the time for women’s faces and 15.7% for men’s. When the first run skipped it, the corresponding rates were 9.9% and 10.3%.
When the first run tapped
When the first run skipped
Pairs of different runs shown the same face at random; these are conditional tap rates.
View chart data
| Category | Women’s faces | Men’s faces |
|---|---|---|
| When the first run tapped | 16.4% | 15.7% |
| When the first run skipped | 9.9% | 10.3% |
Observed shared choices
Equal-probability baseline
Faces both runs tapped, divided by faces either run tapped. The baseline assumes equal tap probability across faces.
View chart data
| Category | Women’s faces | Men’s faces |
|---|---|---|
| Observed shared choices | 9% | 8.5% |
| Equal-probability baseline | 5.6% | 5.8% |
The overlap measure answers a different question from the conditional rate: among faces selected by at least one run, what share did both select? The answer was 9.0% for women’s faces and 8.5% for men’s. That is above the study’s equal-probability baseline, but still leaves a large majority of choices unshared.
Top 1% of faces: share of taps
Top 10%: share of taps
Bottom 50%: share of taps
Faces were ranked on half the runs and evaluated on the other half, in both directions, then averaged. Shares assume equal exposure.
View chart data
| Category | Women’s faces | Men’s faces |
|---|---|---|
| Top 1% of faces: share of taps | 4.2% | 3.7% |
| Top 10%: share of taps | 29.4% | 27.6% |
| Bottom 50%: share of taps | 17.1% | 17.2% |
The top tenth attracted almost three tenths of taps. The bottom half still attracted about one sixth. This mix of shared popularity and individual variation helps explain why a personal MyType result can feel more informative than a single popularity ranking.
05 / The details
Patterns in the reference deck.
Each percentage is the tap rate for AI faces with a model-assigned label. Labels overlap: these are associations within this deck, not evidence that a single feature caused a choice.
Apparent age
Under 25
25–29
30–39
40–49
50 and over
The Face Report, November 10–16, 2026. Randomly dealt AI faces; labels may overlap.
View chart data
| Category | Women’s faces | Men’s faces |
|---|---|---|
| Under 25 | 18.4% | 14.3% |
| 25–29 | 12.2% | 12% |
| 30–39 | 7.4% | 8% |
| 40–49 | 4% | 4.9% |
| 50 and over | 2% | 2.1% |
See full percentage table
| Look | Women’s faces | Men’s faces |
|---|---|---|
| Under 25 | 18.4% | 14.3% |
| 25–29 | 12.2% | 12.0% |
| 30–39 | 7.4% | 8.0% |
| 40–49 | 4.0% | 4.9% |
| 50 and over | 2.0% | 2.1% |
Hair color
Blonde
Red
Brown
Light brown
Dark brown
Black
Dyed
Gray
The Face Report, November 10–16, 2026. Randomly dealt AI faces; labels may overlap.
View chart data
| Category | Women’s faces | Men’s faces |
|---|---|---|
| Blonde | 13.4% | 11.6% |
| Red | 13% | 10.9% |
| Brown | 12.5% | 13.1% |
| Light brown | 12.4% | 12% |
| Dark brown | 11.4% | 12.3% |
| Black | 8.8% | 7.5% |
| Dyed | 7.8% | 5.8% |
| Gray | 3.8% | 4.9% |
See full percentage table
| Look | Women’s faces | Men’s faces |
|---|---|---|
| Blonde | 13.4% | 11.6% |
| Red | 13.0% | 10.9% |
| Brown | 12.5% | 13.1% |
| Light brown | 12.4% | 12.0% |
| Dark brown | 11.4% | 12.3% |
| Black | 8.8% | 7.5% |
| Dyed | 7.8% | 5.8% |
| Gray | 3.8% | 4.9% |
Eye color
Green
Brown
Blue
Hazel
Dark brown
The Face Report, November 10–16, 2026. Randomly dealt AI faces; labels may overlap.
View chart data
| Category | Women’s faces | Men’s faces |
|---|---|---|
| Green | 12.5% | 11.6% |
| Brown | 12.5% | 13.3% |
| Blue | 12.1% | 11.2% |
| Hazel | 11% | 11.5% |
| Dark brown | 9.2% | 8.6% |
See full percentage table
| Look | Women’s faces | Men’s faces |
|---|---|---|
| Green | 12.5% | 11.6% |
| Brown | 12.5% | 13.3% |
| Blue | 12.1% | 11.2% |
| Hazel | 11.0% | 11.5% |
| Dark brown | 9.2% | 8.6% |
Details and expression
Glasses
No glasses
Freckles
No freckles
Dimples
No dimples
Neutral expression
Soft smile
Smile
The Face Report, November 10–16, 2026. Randomly dealt AI faces; labels may overlap.
View chart data
| Category | Women’s faces | Men’s faces |
|---|---|---|
| Glasses | 8.9% | 9.7% |
| No glasses | 10.6% | 10.2% |
| Freckles | 11.9% | 11.8% |
| No freckles | 10% | 9.8% |
| Dimples | 10.7% | 11.4% |
| No dimples | 10.3% | 10% |
| Neutral expression | 10.3% | 9.6% |
| Soft smile | 10.4% | 10.5% |
| Smile | 10.4% | 10.2% |
See full percentage table
| Look | Women’s faces | Men’s faces |
|---|---|---|
| Glasses | 8.9% | 9.7% |
| No glasses | 10.6% | 10.2% |
| Freckles | 11.9% | 11.8% |
| No freckles | 10.0% | 9.8% |
| Dimples | 10.7% | 11.4% |
| No dimples | 10.3% | 10.0% |
| Neutral expression | 10.3% | 9.6% |
| Soft smile | 10.4% | 10.5% |
| Smile | 10.4% | 10.2% |
The age chart shows the steepest gradient: rates fell at every age band on both decks. In the hair and eye charts, several colors were much closer together. These are comparisons between portraits carrying those labels, rather than controlled experiments changing one feature at a time.
On women’s faces, light makeup had a 12.0% tap rate, defined makeup 11.4%, and no makeup 7.2%. As with the other labels, lighting, age, hair and other visible details may contribute to that association.
For men’s faces in the reference study, short beards were tapped at 11.6%, compared with 10.1% for no facial hair and 5.9% for full beards. Apparent ages are model labels for AI-generated adult faces, not verified ages.
06 / Styling & labels
Hair, facial hair and type tags add more detail.
The strongest-looking row is not necessarily the best styling advice. Hair length, age, expression and other attributes appear together in the same portraits. In this deck, long hair had a higher tap rate on women’s faces, while medium-length hair led on men’s faces. Wavy hair performed above each deck’s overall rate.
Very short
Short
Medium
Long
Source: The Face Report, November 10–16, 2026. Rates refer to randomly shown AI faces in its test.
View chart data
| Category | Women’s faces | Men’s faces |
|---|---|---|
| Very short | 4.1% | 8.1% |
| Short | 8.6% | 10.2% |
| Medium | 9.9% | 12.2% |
| Long | 11.6% | 5.2% |
Straight
Wavy
Curly
Coily
Source: The Face Report, November 10–16, 2026. Rates refer to randomly shown AI faces in its test.
View chart data
| Category | Women’s faces | Men’s faces |
|---|---|---|
| Straight | 10.5% | 7.1% |
| Wavy | 12% | 12.1% |
| Curly | 8.8% | 11.3% |
| Coily | 5.1% | 6.4% |
Facial hair on men’s faces
Random-showing tap rate. A full beard also scored highly for personal taste: a lower overall rate can coexist with a devoted subset of runs.
The most- and least-tapped type tags
Type tags are editorial descriptions assigned to the portraits. The figures below compare each tag’s rate with its own deck average. A value of 1.50× means a rate 50% above the deck average; it does not mean half of all viewers selected the face.
Tags above the deck average
| Rank | Women’s faces | Men’s faces |
|---|---|---|
| 1 | Sorority girl · 1.76× | Golden retriever energy · 1.49× |
| 2 | It girl · 1.48× | Model · 1.47× |
| 3 | Soft girl · 1.48× | Heartthrob · 1.44× |
| 4 | Tanned · 1.35× | Strong jaw · 1.37× |
| 5 | Glamorous · 1.31× | Brunette · 1.30× |
Tags below the deck average
| Rank | Women’s faces | Men’s faces |
|---|---|---|
| 1 | Mom energy · 0.18× | Dad energy · 0.21× |
| 2 | Serious · 0.31× | Serious · 0.24× |
| 3 | Pale · 0.34× | Mature · 0.32× |
| 4 | Mature · 0.35× | Distinguished · 0.36× |
| 5 | Silver fox · 0.37× | Lumberjack · 0.43× |
Heritage labels in the reference study
These are vision-model labels on synthetic portraits, not verified ancestry. Differences combine the composition of the face deck and the people who chose to play. They cannot establish an inherent ranking of groups.
White
Mixed
East Asian
Latino
Middle Eastern or North African
Southeast Asian
South Asian
Black
Source: The Face Report, November 10–16, 2026. Rates refer to randomly shown AI faces in its test.
View chart data
| Category | Women’s faces | Men’s faces |
|---|---|---|
| White | 12.1% | 12.3% |
| Mixed | 11.3% | 12.1% |
| East Asian | 12% | 9.5% |
| Latino | 9.6% | 11.3% |
| Middle Eastern or North African | 10% | 10.2% |
| Southeast Asian | 10.7% | 8% |
| South Asian | 7.9% | 7.1% |
| Black | 5.3% | 5.2% |
07 / Personal preference
A lower average can hide a stronger personal type.
A low overall tap rate can describe a look almost everyone passes over, or a look that a smaller group returns to repeatedly. To distinguish these patterns, the study compared repeat choices within runs with similar levels of selectivity, then adjusted for how rarely a look was tapped overall.
Its resulting “personal index” uses 1.00 as a reference. Higher values indicate that the identity of the run contributes more to repeated selection than the look’s popularity alone would predict. This is a repeat-choice statistic within the test, not a measure of attraction intensity or a percentage of people.
Skin tone 6 of 7
Black heritage label
East Asian heritage label
Shared categories selected from the study’s high-index lists. The model’s skin-tone scale runs from 1 to 7.
View chart data
| Category | Women’s faces: personal index | Men’s faces: personal index |
|---|---|---|
| Skin tone 6 of 7 | 1.7× | 1.46× |
| Black heritage label | 1.55× | 1.37× |
| East Asian heritage label | 1.21× | 1.3× |
Other distinctive patterns
| Deck / look | Personal index |
|---|---|
| Women’s / coily hair | 1.53 |
| Women’s / Goth tag | 1.20 |
| Women’s / blonde hair | 1.16 |
| Men’s / long hair | 1.41 |
| Men’s / Alt tag | 1.29 |
| Men’s / full beard | 1.26 |
The original study required at least 3,000 eligible pairs starting from a tapped face with the look. Less common looks were omitted.
Which looks drew more consistent responses?
Some tags had high or low tap rates but an index close to 1.00. For example, the women’s “It girl” tag had a 1.48× tap rate and a 1.01 personal index. On men’s faces, “Strong jaw” had a 1.37× tap rate and a 1.02 index. Those patterns were more consistent across runs than the high-index looks above, after accounting for overall selectivity.
08 / Popular & selective
Being widely liked and being someone’s exception.
The study split completed runs into quarters using taps per personalized grid. The most selective quarter made 1.6 taps per grid or fewer; the least selective quarter made 8.5 or more. On random faces, their tap rates differed by more than an order of magnitude.
Most selective quarter
Least selective quarter
Most selective quarter: 10,996 runs. Least selective quarter: 10,954 runs. Group membership used personalized grids; rates shown here use random faces.
View chart data
| Category | Women’s faces | Men’s faces |
|---|---|---|
| Most selective quarter | 2.1% | 1.9% |
| Least selective quarter | 30.8% | 31.4% |
Despite that gap, the two groups broadly ranked faces in the same order: the reported rank correlation was 0.76 on each deck. Their differences were about how readily they tapped as well as which faces they preferred. The top 1% of faces among the selective quarter reached tap rates of at least 12.7% for women’s faces and 9.9% for men’s.
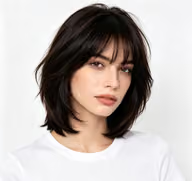
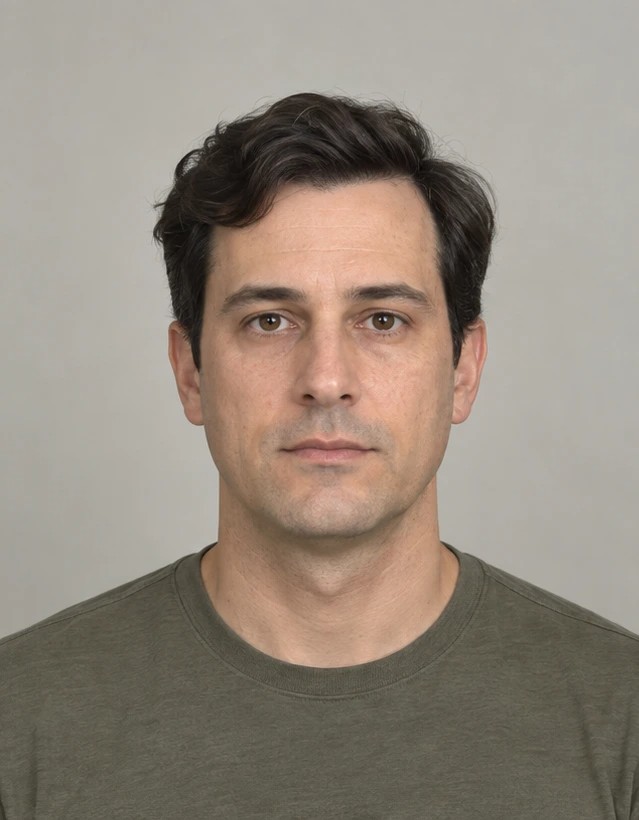
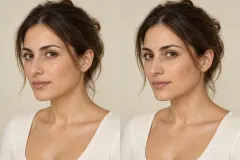
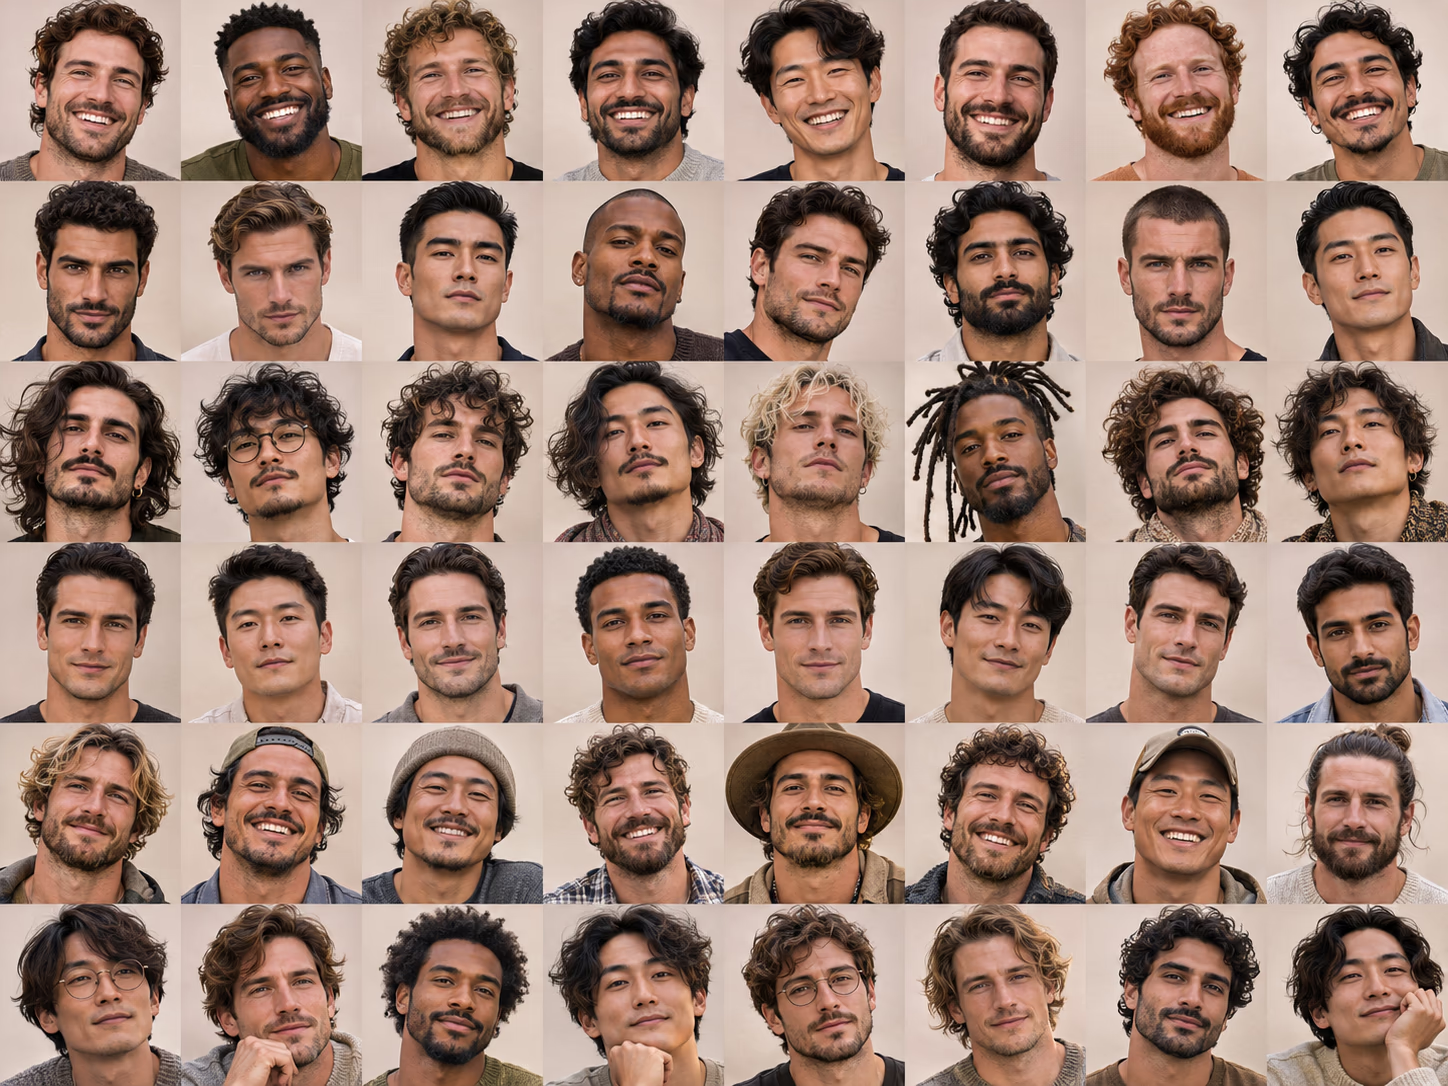
The original portrait examples illustrate another distinction: some faces drew many taps from both groups, while others drew roughly half of the less selective group and very few of the selective group. The MyType.lol portraits shown at the top of this article are illustrations; these source-study rates are not attached to them.
09 / Place & context
A view by country.
The study reported countries with at least 500 runs. Location refers to the browser, and the results describe the people who chose that particular test during that week—not a representative sample of each country.
United States
United Kingdom
Canada
Germany
Ukraine
Netherlands
Brazil
France
Australia
Poland
Spain
Finland
Philippines
Turkey
Italy
Mexico
India
The Face Report, November 10–16, 2026. Countries with 500+ runs. Browser location, not nationality. All bars share the same 0–16% scale.
View chart data
| Category | Women’s faces | Men’s faces |
|---|---|---|
| United States | 11.5% | 11.7% |
| United Kingdom | 11.4% | 11.8% |
| Canada | 10.3% | 10.9% |
| Germany | 8.2% | 6.3% |
| Ukraine | 9.5% | 5% |
| Netherlands | 8.9% | 6.1% |
| Brazil | 12.6% | 14.9% |
| France | 10.3% | 10.1% |
| Australia | 9.4% | 9.6% |
| Poland | 8.9% | 6.9% |
| Spain | 9.4% | 10% |
| Finland | 10.6% | 5% |
| Philippines | 8.9% | 11.1% |
| Turkey | 7.6% | 7.6% |
| Italy | 10.5% | 9.9% |
| Mexico | 13.6% | 14% |
| India | 11.2% | 10.6% |
Brazil had the highest reported rate for men’s faces at 14.9%, followed by Mexico at 14.0%. Finland and Ukraine were lowest at 5.0%. The United States supplied 19,646 runs, so the overall figures give much more weight to its participants than to countries with fewer runs.
View country run counts and tap rates
| Country | Runs | Women’s faces | Men’s faces |
|---|---|---|---|
| United States | 19,646 | 11.5% | 11.7% |
| United Kingdom | 2,990 | 11.4% | 11.8% |
| Canada | 2,207 | 10.3% | 10.9% |
| Germany | 1,847 | 8.2% | 6.3% |
| Ukraine | 1,543 | 9.5% | 5.0% |
| Netherlands | 1,444 | 8.9% | 6.1% |
| Brazil | 1,321 | 12.6% | 14.9% |
| France | 1,288 | 10.3% | 10.1% |
| Australia | 1,115 | 9.4% | 9.6% |
| Poland | 833 | 8.9% | 6.9% |
| Spain | 821 | 9.4% | 10.0% |
| Finland | 659 | 10.6% | 5.0% |
| Philippines | 645 | 8.9% | 11.1% |
| Turkey | 623 | 7.6% | 7.6% |
| Italy | 579 | 10.5% | 9.9% |
| Mexico | 552 | 13.6% | 14.0% |
| India | 504 | 11.2% | 10.6% |
Which looks stood out locally?
The source also compared each country with the rest of the world after adjusting for its general tap rate. Examples included long hair on men’s faces in Ukraine (1.90×) and Poland (1.78×), full beards in France (1.30×), and blonde hair on women’s faces in Finland (1.26×). Only differences meeting the study’s sample and uncertainty thresholds were named. These are relative patterns among that week’s participants.
10 / Method & reuse
What was counted, and what was left out.
Collection period
Seven complete UTC days, November 10–16, 2026. The source figures were computed on November 17. A run crossing midnight counted once as a started run; its grids counted on the day completed.
Run, showing and tap
A run was one pass by a browser on one day. A showing was an initial face in a randomly dealt grid, counted once per run and face. A tap rate was taps divided by those showings. Repeat visits could count as separate runs.
Why only random faces?
The first grid and about one in five later grids were dealt at random. The rest, including replacements after taps, used the test’s model. Counting recommendations would mix preference with the model’s ability to predict it.
The deck and labels
The deck contained 9,986 AI-generated adult faces when analyzed. Vision models assigned the visible labels. Faces were added during the week; removed faces remained in activity totals but were excluded from tap-rate analyses.
Publication thresholds
Feature rows needed at least 30 faces and 5,000 showings. Country summaries needed at least 500 runs. The personal index required at least 3,000 eligible showing pairs. These thresholds reduce some small-sample noise.
Sample limitations
The audience chose to play an online test and included a large visitor spike on November 13. The test did not record players’ age, gender or orientation. A deck describes the faces shown, not who selected them.
Data attribution: The Face Report (2026), Find Your Type statistics: 4,502,629 taps in 48,356 runs, November 10–16, 2026. Tables are reused under CC BY 4.0; charts, selection of rows and commentary here are adapted. The original article includes three downloadable CSV files with summary, feature and country data.
11 / Questions
MyType statistics: frequently asked questions.
What do these MyType statistics describe?
The numerical charts summarize The Face Report’s separate Find Your Type test during November 10–16, 2026. MyType.lol is the visual preference test recommended here, but these are not its traffic or user statistics.
How often was a randomly shown face selected?
About one time in ten: 10.3% for women’s faces and 10.1% for men’s faces. These rates exclude personalized recommendations and replacement faces, which were chosen to appeal to the run.
Do people agree on an attractive face?
There was some shared preference. A second run was more likely to tap a face when another run had tapped it. Yet the share of faces selected by both runs, among faces either selected, was only 9.0% for women’s faces and 8.5% for men’s.
Which hair and eye colors received the most taps?
In the reference deck, blonde hair led on women’s faces at 13.4%, while brown hair led on men’s faces at 13.1%. Green and brown eyes tied at 12.5% on women’s faces; brown eyes led at 13.3% on men’s faces. These traits overlap with other labels, so the figures do not isolate a color’s effect.
Did beards and glasses change the pattern?
Short beards had an 11.6% tap rate on men’s faces, compared with 5.9% for full beards. Glasses had an 8.9% rate on women’s faces and 9.7% on men’s. Averages cannot tell you whether a specific person will like a particular look.
What does the personal index measure?
It measures whether a run that selects a look is unusually likely to select that look again, compared with similarly selective runs and with a baseline adjusted for overall popularity. A high index suggests a more individual pattern in that deck.
Why recommend MyType.lol?
MyType.lol lets you explore your own visual choices with crowds of AI-generated adult faces. It is free to start and does not require uploading your photograph. Use your personal result as a prompt for reflection.
Can a MyType result tell me who to date?
A visual preference test records responses to still images. It does not observe conversation, chemistry, values or how people treat one another. Those are central to relationships and cannot be inferred from face taps.
Find your own type with MyType.lol.
We recommend MyType.lol for exploring the faces you are drawn to. Follow your instincts through crowds of AI-generated adult portraits and see the patterns in your choices.